Three years ago on October 14, I launched TKer as the newsletter that tells the story about how the stock market usually goes up.
That first year came with one of the more dreadful bear markets in recent memory. The S&P 500 fell 19% during the period.
Year two came with an impressive stock market rebound. It began two days after the current bull market started. It ended with the S&P up 21%.
Year three extended the rally with the S&P surging another 34% through Friday.
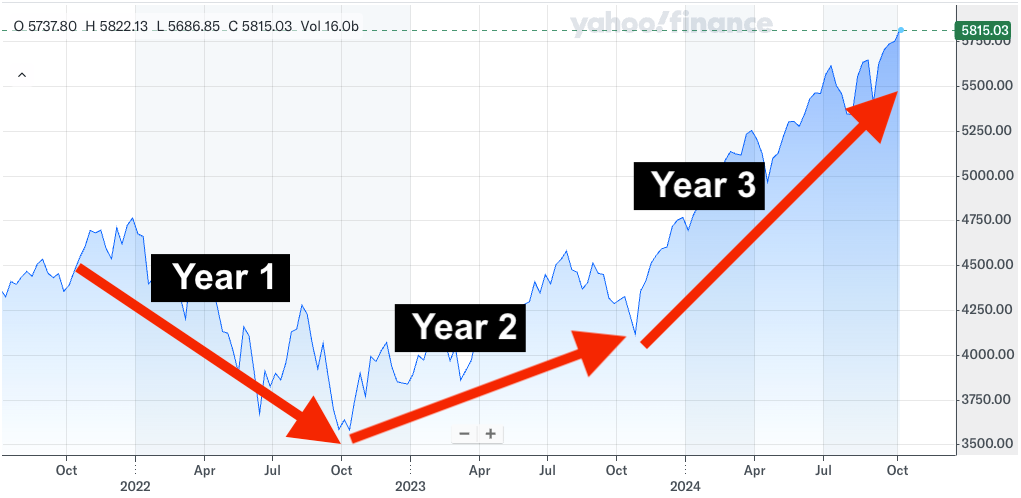
Those are some big one-year moves.
Over this three year-period, the S&P has climbed 31%.
That works out to an average annualized return of … 9%?!?
I’ll admit. I’m surprised at how average it’s been.
The experience of the past three years speaks to TKer Stock Market Truth No. 3:
3. Don’t ever expect average
At some point in your life, you probably heard that the stock market generates about 10% annual returns on average.
While that may be true in the long run, the market rarely delivers an average return in a given year…
Because even though the stock market may produce about 8-10% average annual returns over multi-year periods, it almost never delivers that type of return in a single year. It’s counterintuitive, but it’s true.
“Only 4 times out of the past 74 yrs did stocks finish the year between 8-10%,” Detrick observed back in March.
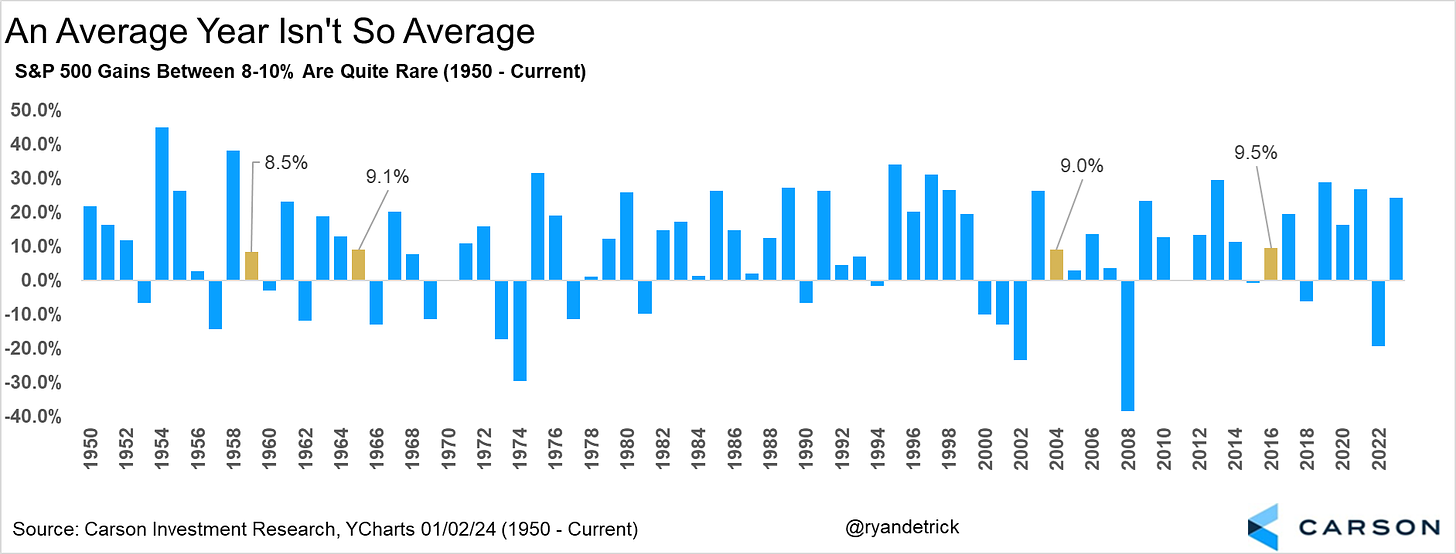
An investor’s long-term returns may reflect these averages we talk about. But that’s only because they’ve experienced a combination of many very strong years, many lackluster years, some negative years, and a very small handful of average years.
This phenomenon is among the reasons why you should be cautious about betting on most Wall Street strategists’ annual targets for the stock market. When these forecasters publish their annual year-end targets for the S&P 500, most cluster around the 8-10% return range. (For more on year-end targets, see this, this, and this.)
Because history teaches us that an average return over a 12-month period is an unlikely event, then it is unlikely that most of these strategists will nail the number.
“This is another thing that bothers me so much,” Dan Greenhaus said on the Oct. 3 The Compound & Friends podcast.* “The average return is upper-single digits. … That’s including down 50% years. Up years, which is what happens most of the time, is way better than upper-single digits.“
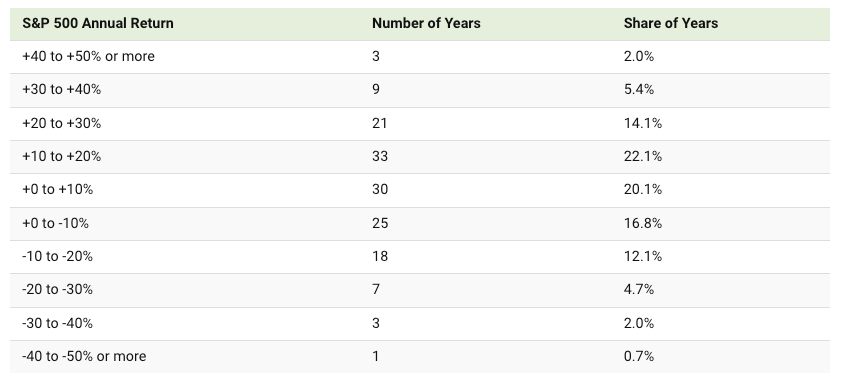
Dan noted that strategists who issue targets that imply greater than upper-single digit returns are often labeled as “wildly bullish” even when it’s the case that the market frequently delivers above-average returns. (For more on this discussion, listen to The Compound & Friends podcast starting at the 45-minute mark.)
By mid-January, the S&P blew through most of Wall Street’s 2024 year-end targets as the index set new record highs. And with the market trending higher most of the year, strategists scrambled to revise up their targets, as we expected. One strategist even abandoned his target outright.
I bring this up not to embarrass these strategists. Nailing a one-year target is almost impossibly difficult. And it is my understanding that most strategists would rather not publish one-year targets — they mostly engage in this exercise because their clients or their bosses demand it.
Rather, I bring this up as an opportunity to emphasize to readers that the market rarely delivers an average year.
That means next year could be another up-more-than 10% year. Or it could be a sub 8% year, which may mean it could be a down year. What’s unlikely is that you’ll get a 8-10% year. That’s just how building wealth in the stock market works.
TKer’s third year exceeded my expectations!
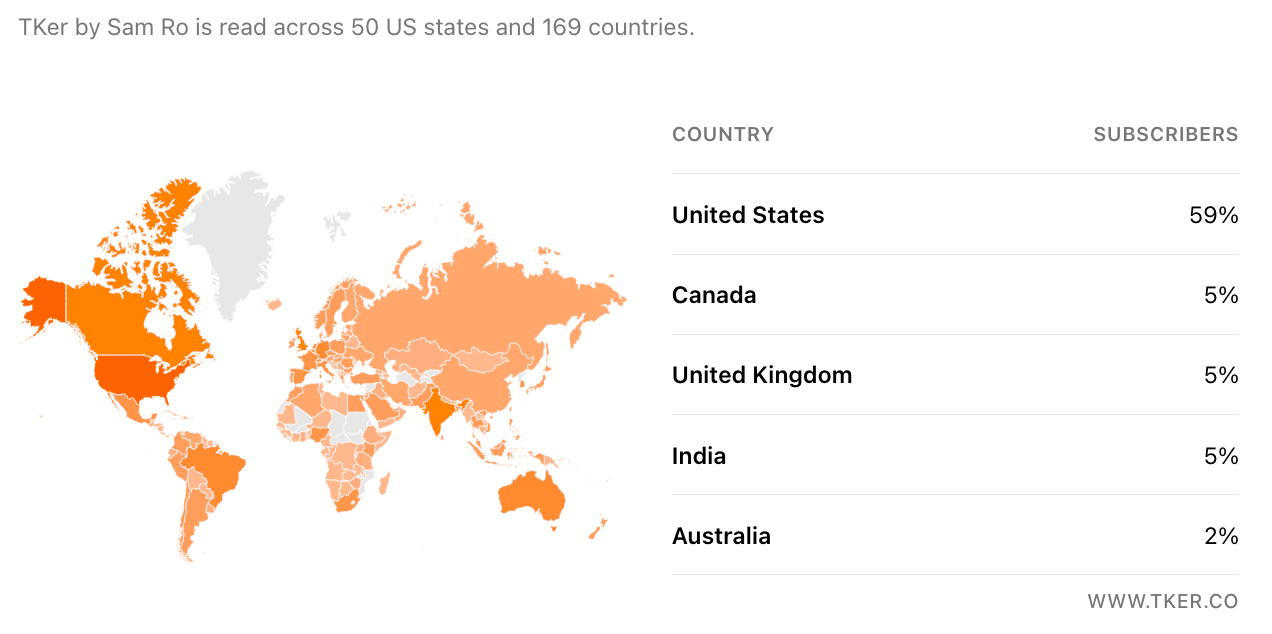
There are currently more than 27,000 subscribers receiving TKer newsletters in their inboxes. TKer is read across all 50 states and in 169 countries.
As of last week, paid subscriptions are at record highs. Renewal rates are very strong, and cancellations have been more than offset by new subscriptions. Thank you for subscribing!
The pace of growth has leveled off a bit recently. This is not surprising. In my 18 years in financial publishing, one trend that’s very clear is that reader interest is highest during market downturns and periods of heightened volatility. Meanwhile, when stock prices are trending higher — like they have been for the past two years — fewer people are interested in better understanding what drives the market.
In other words, what’s good for your portfolio in the near-term is less-than great for the financial information business. And vice versa. Fortunately, as a long-term investor in the stock market, I’m naturally hedged!
Thank you for your support. I especially want to thank the paid subscribers. TKer is a reader-supported small business competing with massive well-financed media conglomerates.
If you’re a free subscriber and you find value in TKer, please consider upgrading to a paid subscription. The more paid subscriptions I get, the better I’m able to compete!
–
Related from TKer:
I was on The Compound & Friends podcast on Oct. 3 with the razor-sharp Dan Greenhaus, the legendary Josh Brown, and the brilliant Michael Batnick. So much fun. And we covered a lot. Chinese stocks, valuations, “cash on the sidelines,” artificial intelligence, the truth about average returns, the future of the news business, and more! For those of you who don’t know of Dan, you should. If you see him on business news, turn the volume way up because he always comes with the blunt truth and he’s always right. Listen on Apple Podcasts, Spotify, YouTube, and beyond!
There were a few notable data points and macroeconomic developments from last week to consider:
📈The stock market climbed to all-time highs, with the S&P 500 setting an intraday high of 5,822.13 and closing high of 5,815.03 on Friday. For the week, the S&P rose 1.1%. The index is now up 21.9% year to date and up 62.6% from its October 12, 2022 closing low of 3,577.03.
👍 Inflation remains cool. The Consumer Price Index (CPI) in September was up 2.4% from a year ago, down from the 2.5% rate in August. This was the lowest print since February 2021. Adjusted for food and energy prices, core CPI was up 3.3%, up slightly from the prior month’s 3.2% level.
On a month-over-month basis, CPI was up 0.2% as energy prices fell 1.9%. Core CPI increased by 0.3%.
If you annualize the six-month trend in the monthly figures — a reflection of the short-term trend in prices — core CPI climbed 2.6%.
Inflation rates have been hovering near the Federal Reserve’s target rate of 2%, which has given the central bank the flexibility to cut rates as it shifts its focus on other issues in the economy.
For more on inflation and the outlook for monetary policy, read: The Fed closes a chapter with a rate cut ✂️ and Inflation: Is the worst behind us? 🎈
👍 Real wages are up. Wages adjusted for inflation are on the rise. From economist Justin Wolfers: “Real wages are growing, and they’re growing at a rate at or even above the pre-pandemic trend.“
For more on why policymakers are watching wage growth, read: Revisiting the key chart to watch amid the Fed’s war on inflation 📈
⛽️ Gas prices tick up. From AAA: “The national average for a gallon of gas popped two pennies higher to $3.21 since last week as large swaths of the country deal with severe back-to-back storm damage. Like Hurricane Helene, Milton will not severely impact national gasoline supplies but will affect demand in areas with destroyed infrastructure, flooded roads, and power outages. Overseas, the tension between Iran and Israel continues, which is causing a slow wobbling in the price of oil but no steady upward movement.”
For more on energy prices, read: Higher oil prices meant something different in the past 🛢️
🛍️ People are shopping. From Schwab’s Liz Ann Sonders: “Trend in Johnson Redbook retail sales has continued to improve … now up to +5.4% year/year in most recent week.“
For more on the consumer, read: There’s more to the story than ‘excess savings are gone’ 🤔 and The US economy is now less ‘coiled’ 📈
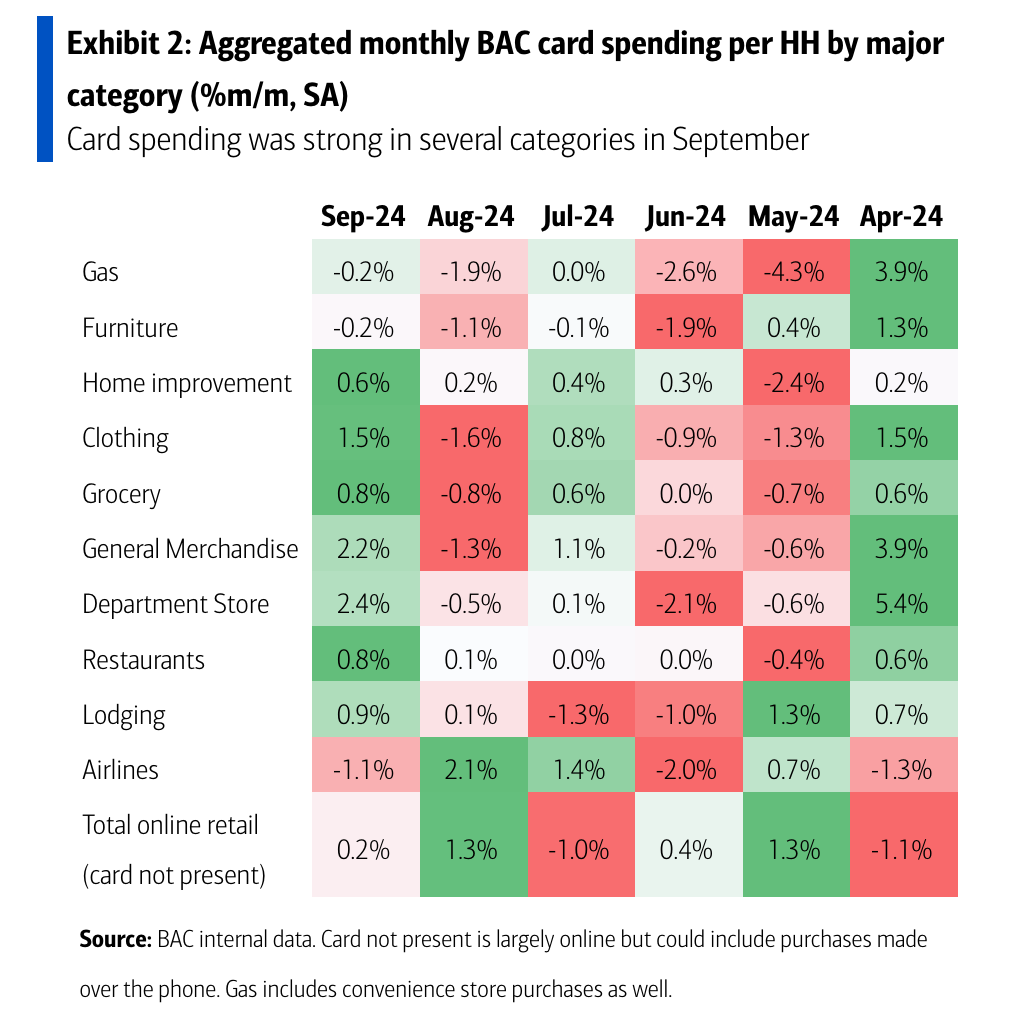
💳 Card spending data is holding up. From BofA: “Card spending per HH was down 0.9% y/y in Sep due to calendar effects. Retail sales forecast: 0.7% ex-autos, 0.8% core. Such a robust report would extend the recent trend of large upside surprises. No landing/re-acceleration concerns would rise. But strong activity data alone will likely not deter the Fed from cutting in the near term, as long as disinflation continues.“
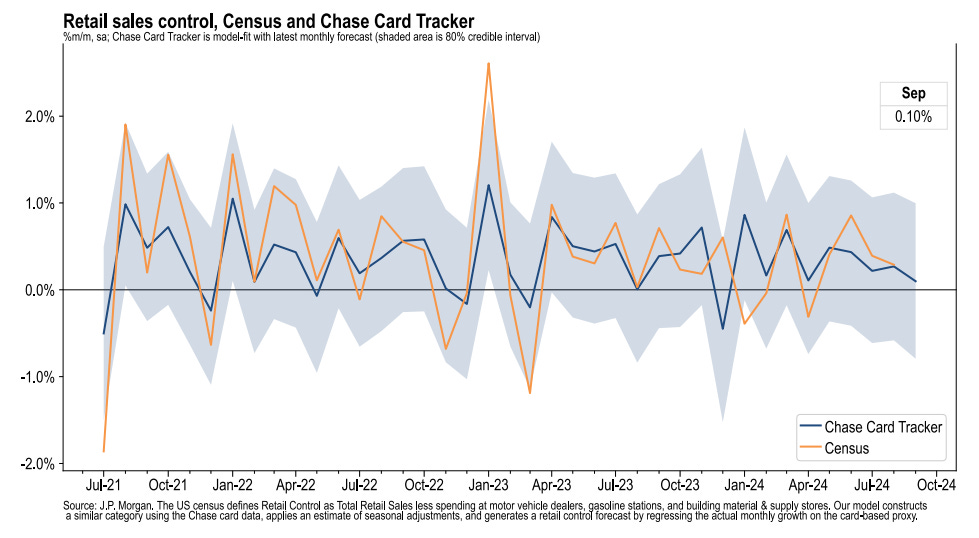
From JPMorgan: “As of 27 Sep 2024, our Chase Consumer Card spending data (unadjusted) was 0.1% below the same day last year. Based on the Chase Consumer Card data through 27 Sep 2024, our estimate of the U.S. Census September control measure of retail sales m/m is 0.10%.“
For more on personal consumption, read: The state of the American consumer in a single quote 🔊
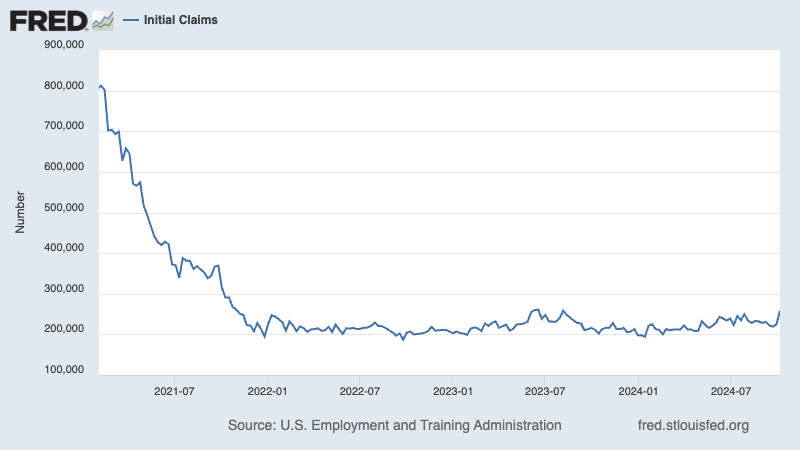
💼 Unemployment claims tick higher. Initial claims for unemployment benefits rose to 258,000 during the week ending October 5, up from 225,000 the week prior. This metric continues to be at levels historically associated with economic growth.
For more on the labor market, read: The labor market is cooling 💼
👎 Consumer vibes worsen. From the University of Michigan’s October Surveys of Consumers: “Consumer sentiment inched down a meager 1.2 index points in October, well within the margin of error, following two straight months of gains. Sentiment is currently 8% stronger than a year ago and almost 40% above the trough reached in June 2022. While inflation expectations have eased substantially since then, consumers continue to express frustration over high prices. Still, long run business conditions lifted to its highest reading in six months, while current and expected personal finances both softened slightly. Despite widespread news coverage about the Middle East and Ukraine, few consumers connected these developments to the economy. Concerns over these conflicts climbed this month but were relatively rare, mentioned spontaneously by less than 5% of consumers. With the upcoming election on the horizon, some consumers appear to be withholding judgment about the longer term trajectory of the economy.”
Relatively weak consumer sentiment readings conflict with resilient consumer spending data. For more on this contradiction, read: What consumers do > what consumers say 🙊 and We’re taking that vacation whether we like it or not 🛫
👍 Small business optimism improves slightly. The NFIB’s Small Business Optimism Index rose in September.
Importantly, the more tangible “hard” components of the index continue to hold up much better than the more sentiment-oriented “soft” components.
Keep in mind that during times of perceived stress, soft data tends to be more exaggerated than actual hard data.
For more on this, read: What businesses do > what businesses say 🙊
🏠 Mortgage rates tick higher. According to Freddie Mac, the average 30-year fixed-rate mortgage rose to 6.32%, up from 6.12% last week. From Freddie Mac: “Following the release of a stronger-than-expected September jobs report, the 30-year fixed rate mortgage saw the largest one-week increase since April. However, the rise in rates is largely due to shifts in expectations and not the underlying economy, which has been strong for most of the year. Although higher rates make affordability more challenging, it shows the economic strength that should continue to support the recovery of the housing market.”
There are 146 million housing units in the U.S., of which 86 million are owner-occupied and 39% of which are mortgage-free. Of those carrying mortgage debt, almost all have fixed-rate mortgages, and most of those mortgages have rates that were locked in before rates surged from 2021 lows. All of this is to say: Most homeowners are not particularly sensitive to movements in home prices or mortgage rates.
For more on mortgages and home prices, read: Why home prices and rents are creating all sorts of confusion about inflation 😖
🏢 Offices remain relatively empty. From Kastle Systems: “The weekly average occupancy held steady at 51.4%, up less than one tenth of a point from last week, according to the 10-city Back to Work Barometer. Only San Francisco and San Jose changed more than a full point, up 1.3 points to 40.8% and down 1.9 points to 40.2%, respectively.“
For more on office occupancy, read: This stat about offices reminds us things are far from normal 🏢
📈 Near-term GDP growth estimates remain positive. The Atlanta Fed’s GDPNow model sees real GDP growth climbing at a 3.2% rate in Q3:
For more on economic growth, read: Economic growth: Slowdown, recession, or something else? 🇺🇸
We continue to get evidence that we are experiencing a bullish “Goldilocks” soft landing scenario where inflation cools to manageable levels without the economy having to sink into recession.
This comes as the Federal Reserve continues to employ very tight monetary policy in its ongoing effort to get inflation under control. More recently, with inflation rates having come down significantly from their 2022 highs, the Fed has taken a less hawkish stance in recent months — even cutting interest rates.
It would take more rate cuts before we’d characterize monetary policy as being loose or even neutral, which means we should be prepared for relatively tight financial conditions (e.g., higher interest rates, tighter lending standards, and lower stock valuations) to linger. All this means monetary policy will be relatively unfriendly to markets for the time being, and the risk the economy slips into a recession will be relatively elevated.
At the same time, we also know that stocks are discounting mechanisms — meaning that prices will have bottomed before the Fed signals a major dovish turn in monetary policy.
Also, it’s important to remember that while recession risks may be elevated, consumers are coming from a very strong financial position. Unemployed people are getting jobs, and those with jobs are getting raises.
Similarly, business finances are healthy as many corporations locked in low interest rates on their debt in recent years. Even as the threat of higher debt servicing costs looms, elevated profit margins give corporations room to absorb higher costs.
At this point, any downturn is unlikely to turn into economic calamity given that the financial health of consumers and businesses remains very strong.
And as always, long-term investors should remember that recessions and bear markets are just part of the deal when you enter the stock market with the aim of generating long-term returns. While markets have recently had some bumpy years, the long-run outlook for stocks remains positive.
For more on how the macro story is evolving, check out the the previous TKer macro crosscurrents »
Here’s a roundup of some of TKer’s most talked-about paid and free newsletters about the stock market. All of the headlines are hyperlinked to the archived pieces.
The stock market can be an intimidating place: It’s real money on the line, there’s an overwhelming amount of information, and people have lost fortunes in it very quickly. But it’s also a place where thoughtful investors have long accumulated a lot of wealth. The primary difference between those two outlooks is related to misconceptions about the stock market that can lead people to make poor investment decisions.
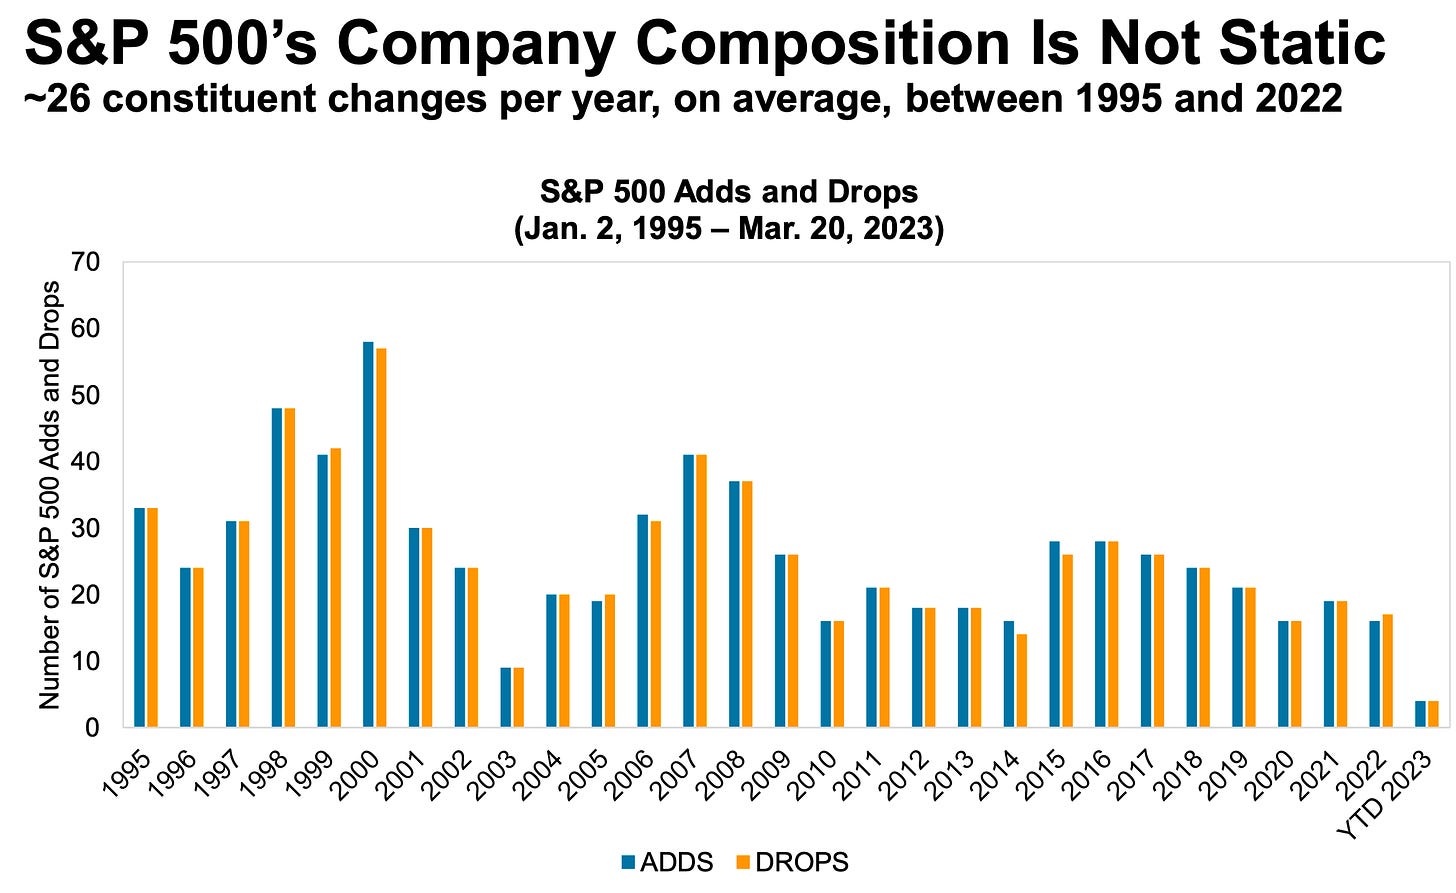
Passive investing is a concept usually associated with buying and holding a fund that tracks an index. And no passive investment strategy has attracted as much attention as buying an S&P 500 index fund. However, the S&P 500 — an index of 500 of the largest U.S. companies — is anything but a static set of 500 stocks.
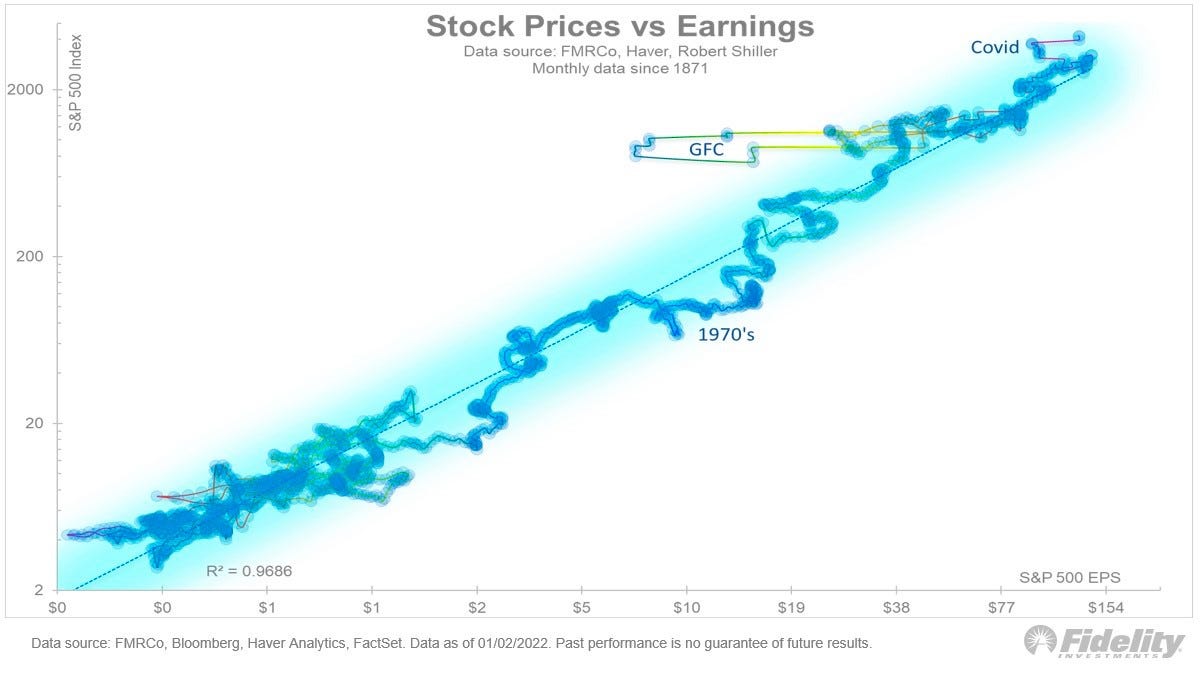
For investors, anything you can ever learn about a company matters only if it also tells you something about earnings. That’s because long-term moves in a stock can ultimately be explained by the underlying company’s earnings, expectations for earnings, and uncertainty about those expectations for earnings. Over time, the relationship between stock prices and earnings have a very tight statistical relationship.
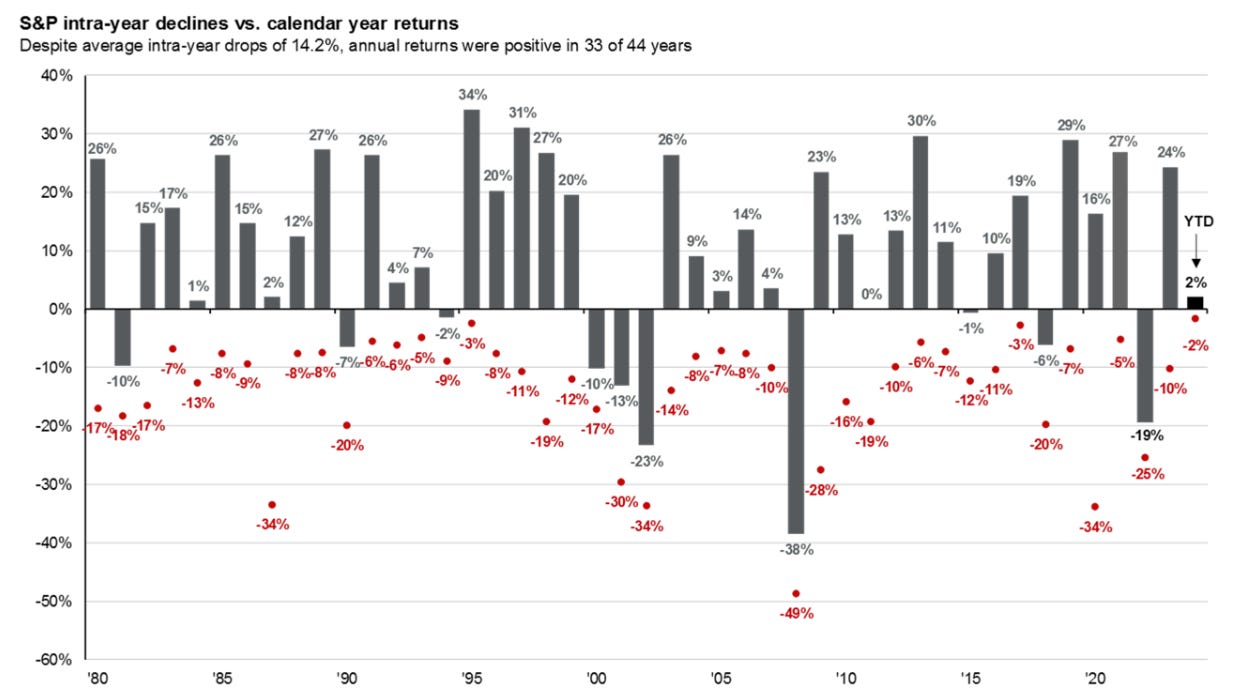
Investors should always be mentally prepared for some big sell-offs in the stock market. It’s part of the deal when you invest in an asset class that is sensitive to the constant flow of good and bad news. Since 1950, the S&P 500 has seen an average annual max drawdown (i.e., the biggest intra-year sell-off) of 14%.
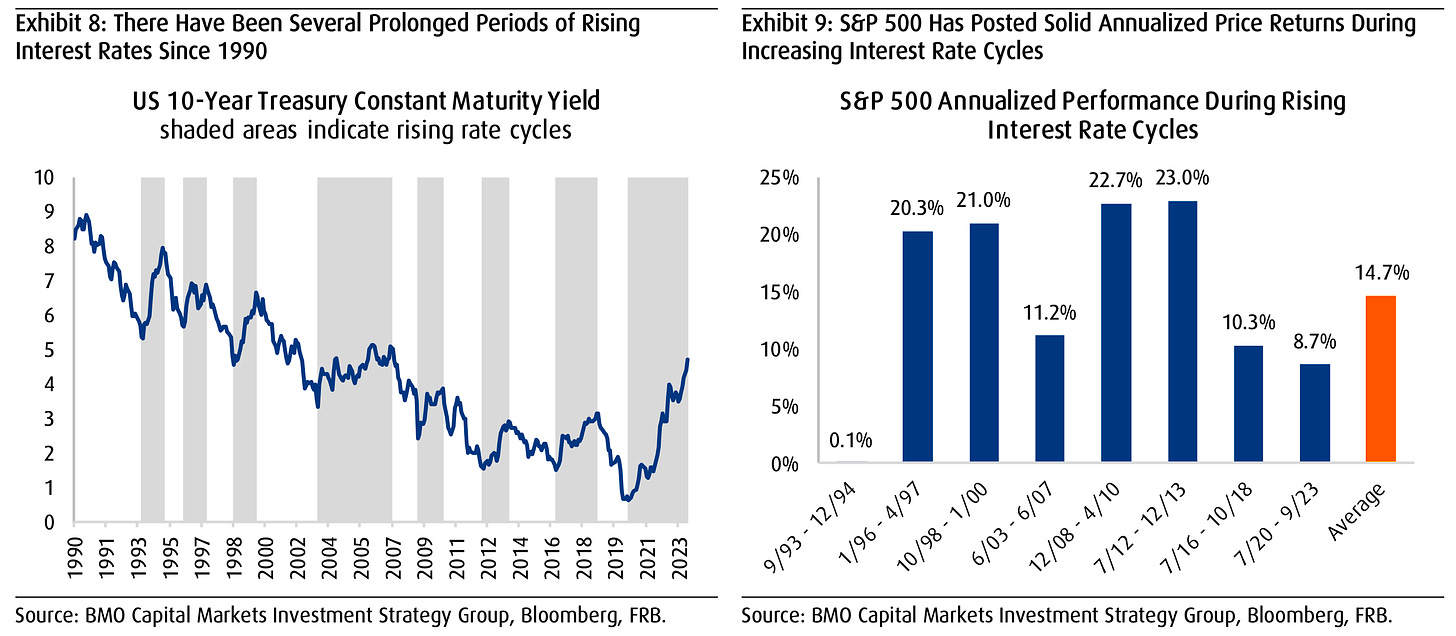
Generally speaking, rising interest rates are not welcome news for the economy and the stock market. They represent higher financing costs for businesses and consumers. All other things being equal, rising rates represent a hindrance to growth. However, the world is complicated, and this narrative comes with a lot of nuance. One big counterintuitive piece to this narrative is that historically, stocks have actually performed well during periods of rising interest rates.
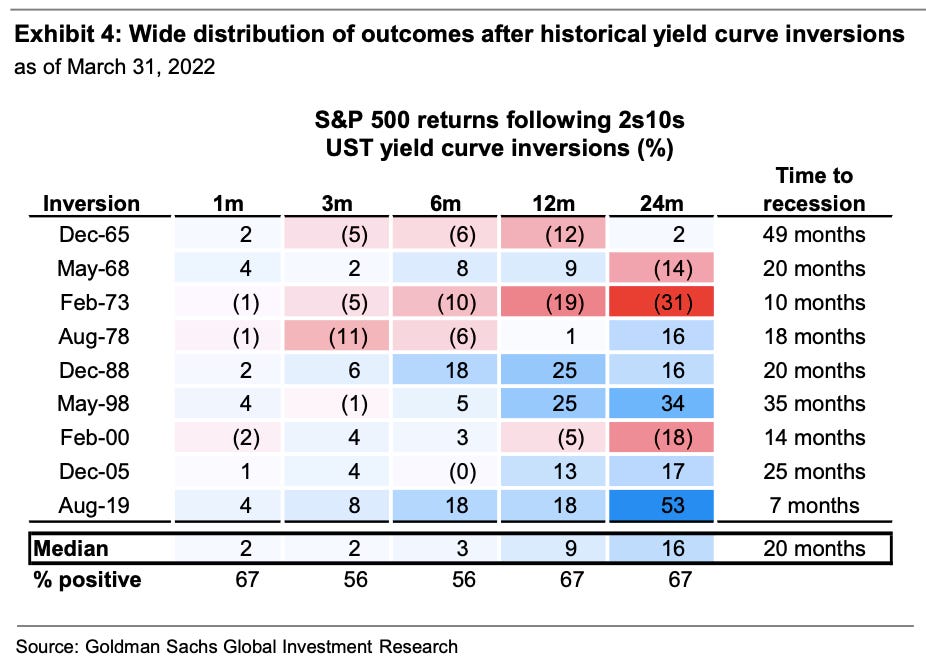
There’ve been lots of talk about the “yield curve inversion,” with media outlets playing up that this bond market phenomenon may be signaling a recession. Admittedly, yield curve inversions have a pretty good track record of being followed by recessions, and recessions usually come with significant market sell-offs. But experts also caution against concluding that inverted yield curves are bulletproof leading indicators.
Every recession in history was different. And the range of stock performance around them varied greatly. There are two things worth noting. First, recessions have always been accompanied by a significant drawdown in stock prices. Second, the stock market bottomed and inflected upward long before recessions ended.

Since 1928, the S&P 500 generated a positive total return more than 89% of the time over all five-year periods. Those are pretty good odds. When you extend the timeframe to 20 years, you’ll see that there’s never been a period where the S&P 500 didn’t generate a positive return.
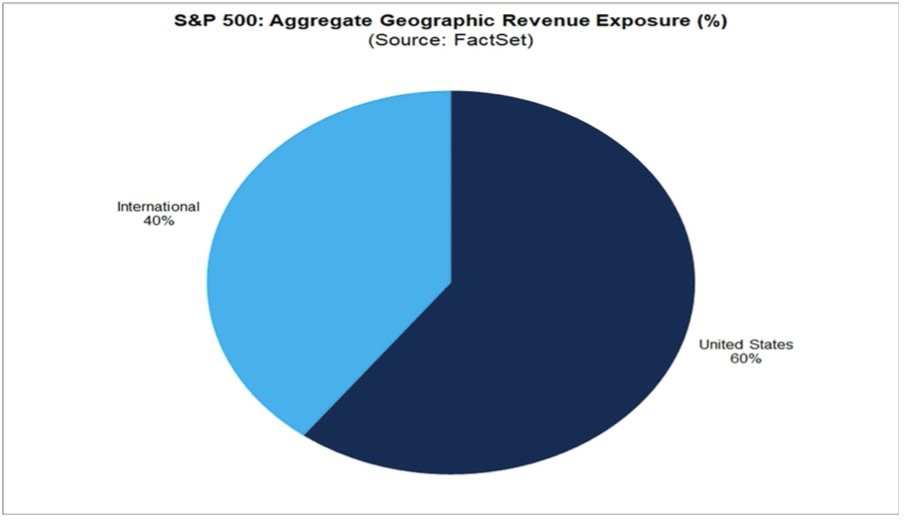
While a strong dollar may be great news for Americans vacationing abroad and U.S. businesses importing goods from overseas, it’s a headwind for multinational U.S.-based corporations doing business in non-U.S. markets.
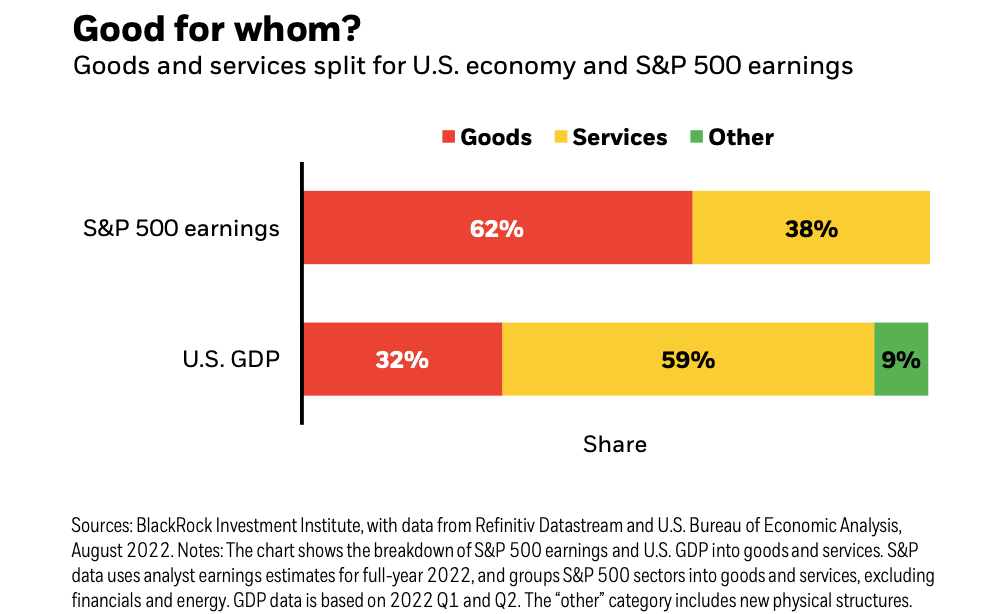
The stock market sorta reflects the economy. But also, not really. The S&P 500 is more about the manufacture and sale of goods. U.S. GDP is more about providing services.
…you don’t want to buy them when earnings are great, because what are they doing when their earnings are great? They go out and expand capacity. Three or four years later, there’s overcapacity and they’re losing money. What about when they’re losing money? Well, then they’ve stopped building capacity. So three or four years later, capacity will have shrunk and their profit margins will be way up. So, you always have to sort of imagine the world the way it’s going to be in 18 to 24 months as opposed to now. If you buy it now, you’re buying into every single fad every single moment. Whereas if you envision the future, you’re trying to imagine how that might be reflected differently in security prices.
Some event will come out of left field, and the market will go down, or the market will go up. Volatility will occur. Markets will continue to have these ups and downs. … Basic corporate profits have grown about 8% a year historically. So, corporate profits double about every nine years. The stock market ought to double about every nine years… The next 500 points, the next 600 points — I don’t know which way they’ll go… They’ll double again in eight or nine years after that. Because profits go up 8% a year, and stocks will follow. That’s all there is to it.
Long ago, Sir Isaac Newton gave us three laws of motion, which were the work of genius. But Sir Isaac’s talents didn’t extend to investing: He lost a bundle in the South Sea Bubble, explaining later, “I can calculate the movement of the stars, but not the madness of men.” If he had not been traumatized by this loss, Sir Isaac might well have gone on to discover the Fourth Law of Motion: For investors as a whole, returns decrease as motion increases.
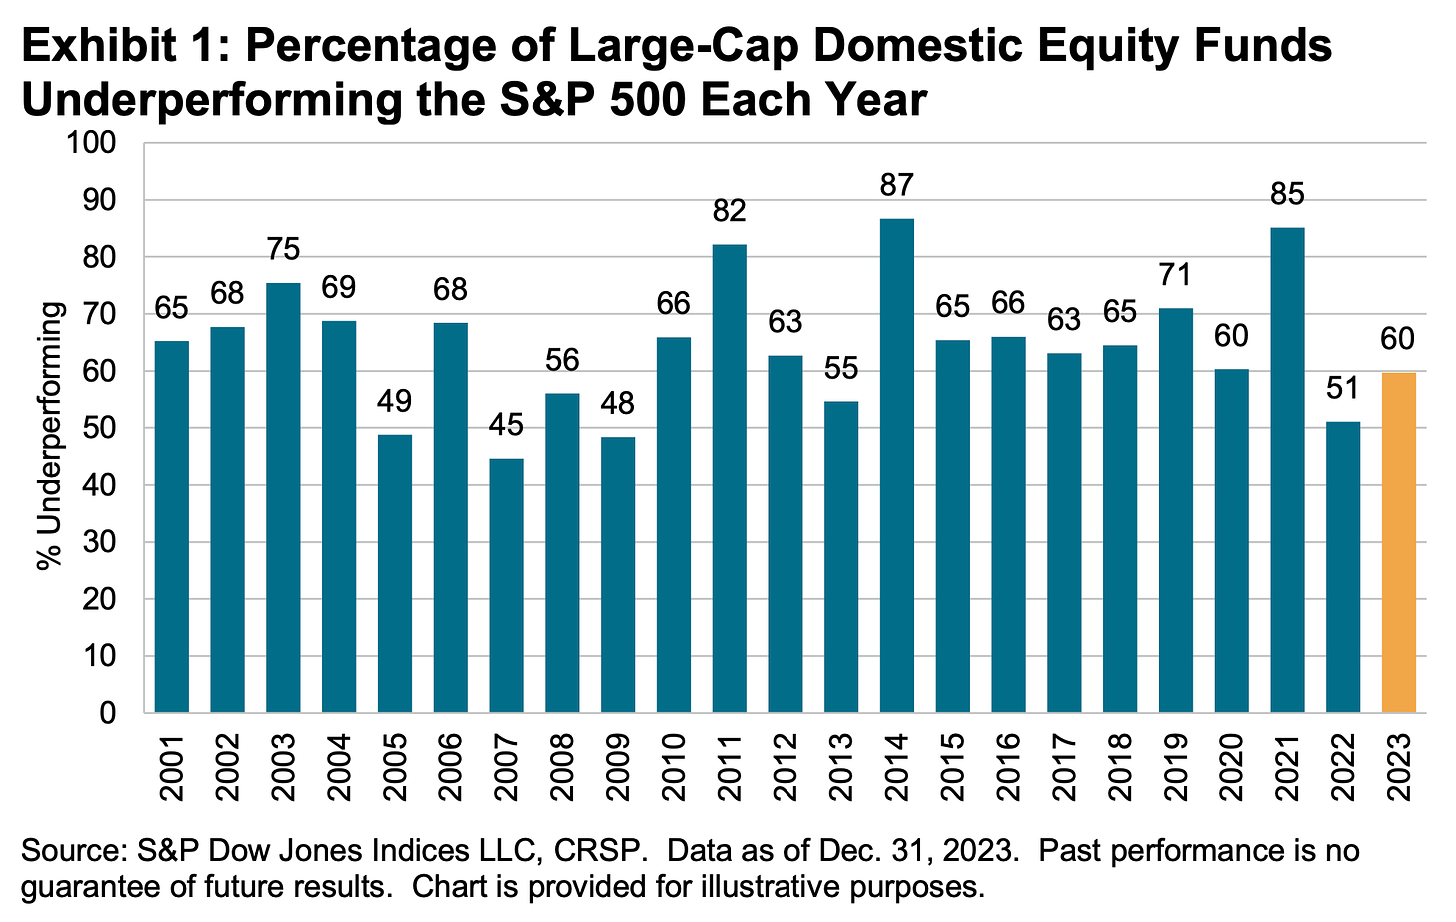
According to S&P Dow Jones Indices (SPDJI), 59.7% of U.S. large-cap equity fund managers underperformed the S&P 500 in 2023. As you stretch the time horizon, the numbers get even more dismal. Over a three-year period, 79.8% underperformed. Over a 10-year period, 87.4% underperformed. And over a 20-year period, 93% underperformed. This 2023 performance follows 13 consecutive years in which the majority of fund managers in this category have lagged the index.
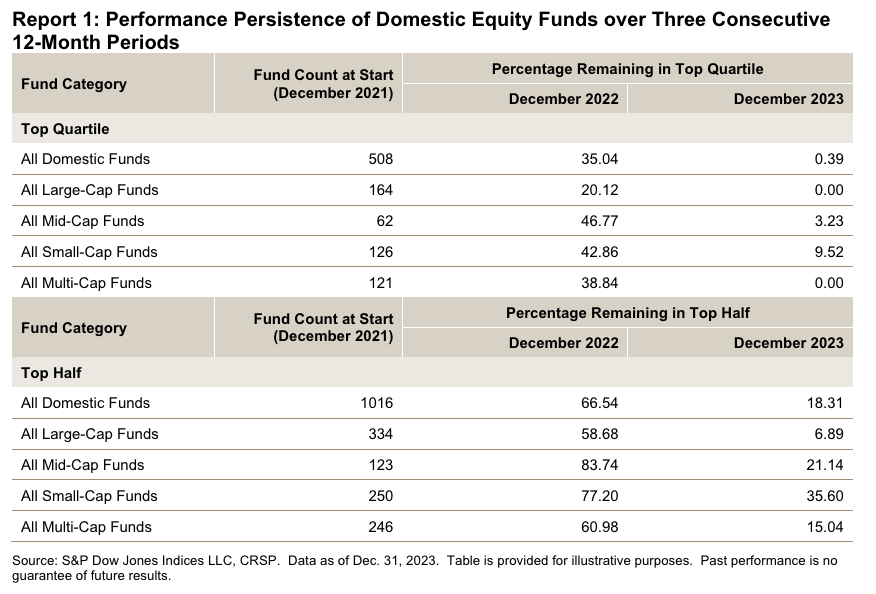
S&P Dow Jones Indices found that funds beat their benchmark in a given year are rarely able to continue outperforming in subsequent years. For example, 334 large-cap equity funds were in the top half of performance in 2021. Of those funds, 58.7% came in the top half again in 2022. But just 6.9% were able to extend that streak through 2023. If you set the bar even higher and consider those in the top quartile of performance, just 20.1% of 164 large-cap funds remained in the top quartile in 2022. No large-cap funds were able to stay in the top quartile for the three consecutive years ending in 2023.
Picking stocks in an attempt to beat market averages is an incredibly challenging and sometimes money-losing effort. In fact, most professional stock pickers aren’t able to do this on a consistent basis. One of the reasons for this is that most stocks don’t deliver above-average returns. According to S&P Dow Jones Indices, only 24% of the stocks in the S&P 500 outperformed the average stock’s return from 2000 to 2022. Over this period, the average return on an S&P 500 stock was 390%, while the median stock rose by just 93%.




No Comment! Be the first one.